A good mathematics inquiry begins with something students can try and ends with something they need to explain. It can fit inside an ordinary lesson: a surprising discount, an unfair game, a changing pattern or a model whose answer depends on the assumptions.
These 10 IB MYP Mathematics inquiry activities are original, low-preparation tasks you can use tomorrow. Each comes with a printable student sheet and separate teacher guidance, including checked answers or expected findings, a neutral prompt, support and an extension. The suggested year ranges are starting points; choose according to your students’ prior learning.
Choose an activity for tomorrow
| Activity | Suggested MYP years | Time | Main mathematics |
|---|---|---|---|
| 1. How many tiles make a border? | 1-3 | 35 min | Patterns and algebra |
| 2. Does the order of discounts matter? | 1-3 | 30 min | Percentages |
| 3. Can a spinner game be fair? | 1-3 | 40 min | Probability |
| 4. Which rectangle gives the most space? | 1-3 | 35 min | Area and optimisation |
| 5. When should you switch plans? | 2-4 | 40 min | Linear models |
| 6. Can an average hide the story? | 2-4 | 30 min | Statistics |
| 7. Does doubling length double everything? | 2-4 | 40 min | Similarity and measurement |
| 8. Which dice total should you choose? | 2-4 | 40 min | Sample spaces |
| 9. How large can an open box be? | 4-5 | 50 min | Quadratic area and cubic volume |
| 10. Which savings plan wins over time? | 4-5 | 45 min | Linear and exponential models |
What makes these activities an inquiry?
Students make a choice, investigate its consequences and defend a conclusion. They might select a representation, decide which cases are useful, compare models or test a conjecture independently. The mathematical work remains central: a context alone does not create an inquiry if every decision has already been made for the learner.
The IB’s MYP mathematics overview places inquiry and application at the heart of mathematical learning. These activities offer classroom ways to develop that thinking. They are Full Marks Education resources, not IB-issued or IB-endorsed tasks.
Use them formatively. Pattern tasks can help develop investigation habits; contextual tasks can help students build and evaluate models. A short activity is not automatically a complete Criterion B or Criterion D assessment. Select the relevant objectives and use your school’s current licensed guidance when designing a summative task.
1. How many tiles make a border?
Suggested MYP Years 1-3 · 35 minutes · Patterns and algebra
Materials: Squared paper; two colours.
Inquiry question: How can you count the one-tile-wide border of any square grid without counting each tile?
Draw square grids with side lengths 3, 4 and 5 tiles. Shade only the outside border. A corner tile counts once. Investigate whole-number side lengths n of at least 3.
Run it tomorrow: Choose a way to count border tiles and organise your results. Investigate more sizes if helpful. Describe the relationship and write a rule for the border count B in terms of n. Then ask students to compare methods before they predict the count for a 12 by 12 grid; check it by another method.
Why it works: The same picture supports several valid expressions, giving students a reason to explain equivalence rather than simply simplify algebra. Ask: “Which tiles does each part of your expression count?”
Support: Allow physical counters and a partially drawn grid. Extend: Generalise to an a by b rectangle with a, b >= 3, then to a border two tiles wide.
Download the student task and teacher notes (2-page PDF). The second page includes the solution and guidance; keep it separate until students have investigated.
2. Does the order of discounts matter?
Suggested MYP Years 1-3 · 30 minutes · Percentages
Materials: Calculator; paper.
Inquiry question: Is a 20% discount followed by a 10% discount the same as 30% off?
A fictional shop sells an item for 80 currency units. Offer A gives 20% off, then a further 10% off the reduced price. Offer B gives 30% off the original price. There are no taxes or extra fees.
Run it tomorrow: Predict which offer is better and explain your initial reasoning. Calculate the final price under each offer; represent the changes with a diagram or multipliers. Then ask students to compare methods before they test other starting prices. Does your conclusion depend on the original price?
Why it works: A familiar shopping claim exposes additive reasoning and creates a useful bridge to multiplicative models. Ask: “What quantity is the second percentage calculated from?”
Support: Use a 100-unit starting price before returning to 80. Extend: For discounts a% and b%, derive the effective discount a + b - ab/100 percent.
Download the student task and teacher notes (2-page PDF). The second page includes the solution and guidance; keep it separate until students have investigated.
3. Can a spinner game be fair?
Suggested MYP Years 1-3 · 40 minutes · Probability
Materials: Paper; pencil; optional spinner.
Inquiry question: Can you redesign a spinner so neither player has an advantage?
A spinner has eight equally likely sectors: five blue and three gold. Blue awards Player A one point; gold awards Player B one point. Each spin is independent. You may simulate by drawing one of eight labelled slips and replacing it each time.
Run it tomorrow: Predict the scores after 80 spins and explain the assumptions. Run 40 trials and record both frequencies. Compare the results with your prediction. Then ask students to compare methods before they redesign the sector colours to make equal one-point rewards fair.
Why it works: Students distinguish observed results from a probability model and discover that fairness needs a precise definition. Ask: “Do you mean equal chances of scoring, equal expected points, or equal chances of winning a whole match?”
Support: List all eight equally likely outcomes and begin with the colour redesign. Extend: Explain why equal expected points need not give equal probabilities of winning a fixed-length match.
Download the student task and teacher notes (2-page PDF). The second page includes the solution and guidance; keep it separate until students have investigated.
4. Which rectangle gives the most space?
Suggested MYP Years 1-3 · 35 minutes · Area and optimisation
Materials: Squared paper; ruler.
Inquiry question: If every rectangle has the same perimeter, must it have the same area?
You have 24 units of fencing to enclose a rectangle. Use positive whole-number side lengths. All four sides need fencing; no gates or shared walls are included.
Run it tomorrow: Find every different rectangle you can make; rotating a rectangle does not make a new case. Compare areas and choose a representation that reveals a pattern. Then ask students to compare methods before they identify the largest area and explain why your list is complete.
Why it works: A small set of accessible trials opens into a general argument and a discussion of domain restrictions. Ask: “How will you know you have found every distinct rectangle?”
Support: Provide 24 unit strips and allow trial constructions. Extend: Generalise to perimeter P: show the maximum area is P²/16 for positive real side lengths.
Download the student task and teacher notes (2-page PDF). The second page includes the solution and guidance; keep it separate until students have investigated.
5. When should you switch plans?
Suggested MYP Years 2-4 · 40 minutes · Linear models
Materials: Calculator; graph paper.
Inquiry question: Which hire plan is cheaper, and when does the answer change?
A fictional bicycle hire service offers Plan A at 6 currency units plus 2 per hour, or Plan B at 15 plus 0.5 per hour. Time t is measured continuously for 0 <= t <= 8 hours. There are no extra charges or rounding rules.
Run it tomorrow: Choose useful hire times and compare both costs. Represent the relationship with equations and a graph, defining your variables and units. Then ask students to compare methods before they find the break-even time and justify your recommendation for shorter and longer hires.
Why it works: The recommendation must depend on the model and its domain, giving equations and graphs a practical purpose. Ask: “What do the intercept and gradient mean in this situation?”
Support: Start with a table at 0, 2, 4, 6 and 8 hours. Extend: Design a third plan that is cheapest for some, but not all, times in the domain.
Download the student task and teacher notes (2-page PDF). The second page includes the solution and guidance; keep it separate until students have investigated.
6. Can an average hide the story?
Suggested MYP Years 2-4 · 30 minutes · Statistics
Materials: Calculator; paper.
Inquiry question: Which average best describes a typical journey when one result is unusually large?
These are fictional journey times in minutes for seven students: 8, 9, 10, 10, 11, 12, 45. Use only the supplied data; you do not need to collect personal information.
Run it tomorrow: Calculate the mean and median. Decide which better communicates a typical journey and justify your choice. Represent the data on a number line and explain why the two averages differ. Then ask students to compare methods before they replace 45 with 15, then with 90. Track which statistics change.
Why it works: Students must make and defend a statistical choice, rather than treat every average as an interchangeable calculation. Ask: “What question does your chosen average answer, and what information does it conceal?”
Support: Order the data physically using number cards. Extend: Investigate the effect on mean and median of adding the same value to every observation.
Download the student task and teacher notes (2-page PDF). The second page includes the solution and guidance; keep it separate until students have investigated.
7. Does doubling length double everything?
Suggested MYP Years 2-4 · 40 minutes · Similarity and measurement
Materials: Squared paper; ruler.
Inquiry question: When a design is enlarged, what happens to perimeter and area?
A rectangular logo is 3 cm wide and 2 cm high. Create similar copies using scale factors 2, 3 and 4. Every length is multiplied by the same factor.
Run it tomorrow: Predict the new perimeters and areas before calculating. Draw or tabulate the copies and compare length, perimeter and area ratios. Then ask students to compare methods before they state and explain general rules for positive scale factor k.
Why it works: A concrete enlargement makes it possible to confront a common misconception using both diagrams and algebra. Ask: “Can your diagram explain why there are two factors of k in the area?”
Support: Use unit squares at k = 2 before making a table. Extend: For similar boxes, compare volume and surface-area scale factors and discuss packaging material.
Download the student task and teacher notes (2-page PDF). The second page includes the solution and guidance; keep it separate until students have investigated.
8. Which dice total should you choose?
Suggested MYP Years 2-4 · 40 minutes · Sample spaces
Materials: Two fair six-sided dice; paper.
Inquiry question: If you win when two dice add to your chosen total, is every total equally good?
Two independent fair six-sided dice are rolled. You choose one integer total from 2 to 12 before rolling and score one point whenever that total occurs. All successful totals pay the same reward.
Run it tomorrow: Choose a total and justify your initial strategy. Run 30 trials with a partner and compare frequencies. Keep a tally of every total. Then ask students to compare methods before they construct a complete sample space that distinguishes the first die from the second.
Why it works: Comparing simulation with an explicit sample space makes the source of probability claims visible. Ask: “What are the equally likely outcomes: totals, individual faces, or ordered pairs?”
Support: Provide an empty 6 by 6 grid with die values as row and column headings. Extend: Choose rewards that give equal expected points for totals 2 and 7; compare risk as well as expectation.
Download the student task and teacher notes (2-page PDF). The second page includes the solution and guidance; keep it separate until students have investigated.
9. How large can an open box be?
Suggested MYP Years 4-5 · 50 minutes · Quadratic area and cubic volume
Materials: Paper; ruler; scissors optional; calculator.
Inquiry question: Which corner cut makes the largest open box from a fixed sheet?
A sheet measures 20 cm by 30 cm. Cut equal squares of side x cm from all four corners and fold up the sides to form an open box. Ignore material thickness and tabs. First restrict x to whole centimetres with 1 <= x <= 9.
Run it tomorrow: Sketch the net and express the box dimensions in terms of x. Choose a systematic method to compare all permitted cuts. Then ask students to compare methods before they find the best whole-centimetre cut and check your volume independently.
Why it works: A simple net connects spatial reasoning to functions, constraints and the precision of a recommendation. Ask: “How do you know your proposed maximum is the largest across the domain you are using?”
Support: Build the x = 2 net and label each dimension before writing a formula. Extend: Compare the integer optimum with the continuous optimum and evaluate the practical significance of the difference.
Download the student task and teacher notes (2-page PDF). The second page includes the solution and guidance; keep it separate until students have investigated.
10. Which savings plan wins over time?
Suggested MYP Years 4-5 · 45 minutes · Linear and exponential models
Materials: Calculator; optional spreadsheet.
Inquiry question: Does a plan that grows by a fixed amount always beat one that grows by a fixed percentage?
Two fictional accounts start with 100 currency units at year 0. Account A adds a fixed bonus of 20 at each year end. Account B grows by 15% at each year end. There are no deposits, withdrawals, taxes or fees; keep full precision until reporting.
Run it tomorrow: Compare balances for whole years 0 through 8. Predict when one plan overtakes the other. Write expressions for both balances after n years and identify the domain. Then ask students to compare methods before they find the first whole year when B exceeds A and check the years immediately before and after.
Why it works: Students compare two kinds of growth and must report a result that matches a discrete time model. Ask: “What is the percentage applied to each year, and why does that change the size of the increase?”
Support: Build the first three years by repeated addition and multiplication. Extend: Change the fixed bonus and percentage, then investigate which assumptions control the crossing year.
Download the student task and teacher notes (2-page PDF). The second page includes the solution and guidance; keep it separate until students have investigated.
A simple lesson routine
- Launch for five minutes. Read the situation, establish definitions and ask for a prediction. Check students understand the constraints without supplying the investigative method.
- Give students time to explore. Ask them to retain their first attempts, record useful cases and explain why they chose a representation. Use the task’s suggested duration to plan this phase.
- Compare approaches for seven minutes. Select two responses that reveal different reasoning. Ask what each method makes easier to see and which claims still need checking.
- Finish with a three-minute exit response. Ask, “What did you revise, and what evidence changed your mind?” Use the answers to plan the next lesson.
Resist turning every prompt into a compulsory sequence of techniques. If a learner finds a different valid approach, make room for it. Give more explicit scaffolding when necessary and note the support used if you later discuss the work as assessment evidence.
Turn a useful lesson into a coherent MYP sequence
The free downloads give you ten focused lessons. If you need the supporting explanations, practice and unit planning around inquiry, explore the Full Marks Education MYP curriculum kits. The current year-level kits include editable lesson slides, student and teacher notes, assignments or worksheets, inquiry projects and paper-based eAssessment-style unit exams. Check each product page for its exact contents; these are independently produced teaching materials.
- MYP Year 1 Curriculum Kit — view the contents and current price.
- MYP Year 2 Curriculum Kit — view the contents and current price.
- MYP Year 3 Curriculum Kit — view the contents and current price.
- MYP Year 4 Curriculum Kit — view the contents and current price.
- MYP Year 5 Curriculum Kit — view the contents and current price.
If you mainly want editable teaching presentations, the MYP Year 1, Year 2, Year 3, Year 4 and Year 5 slide deck bundles offer a more focused option. Choose a kit when you need the wider resource collection, or a slide bundle when presentations are your main planning need.
Frequently asked questions
Do I need technology?
No specialist software is required. Some tasks use a calculator, and a spreadsheet can make the growth comparison easier. The spinner can be simulated with labelled slips. Students can investigate the box using a sketch if cutting equipment is unavailable.
Can I adapt the numbers or year group?
Yes. Change the values, context or amount of support to suit your class, then check that your revised version still has the intended mathematical structure. The year labels here are suggestions, not prescribed IB topic allocations.
Can these be summative assessments?
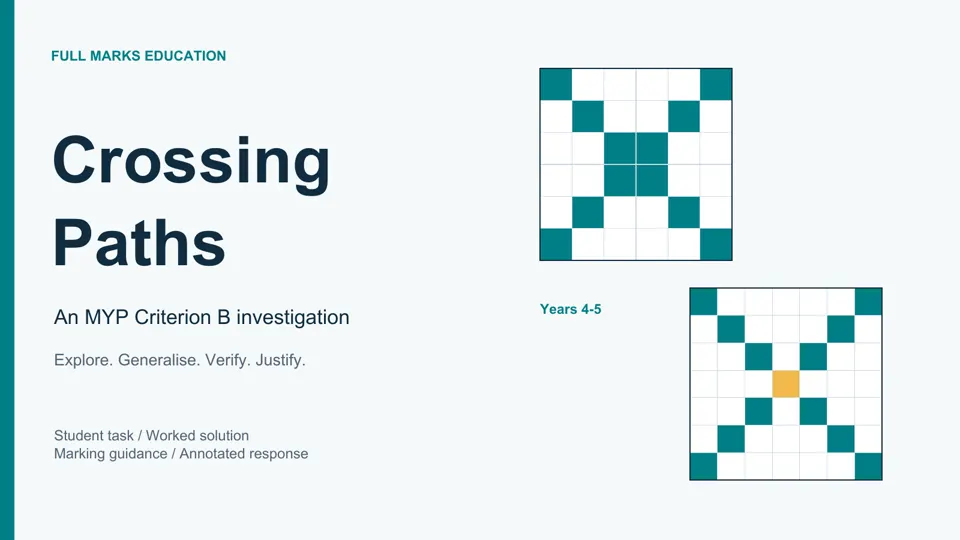
The solutions are public, and the prompts include support, so the pack is best used for learning and formative feedback. A summative assessment needs appropriate task design, independent student work and alignment with the applicable descriptors. For more assessment-focused examples, see the free Criterion B investigation pack and Criterion D application article.
Choose one activity, print the student page and begin with a prediction. The most useful outcome is a conclusion students can explain, test and improve.